 Free quiz to know your sales aptitude
 Sales Pipeline Calculator

By analyzing CRM data, it is possible to observe customer and sales team behavior from a unique perspective and uncover patterns that are often hidden beneath day-to-day commercial activity.
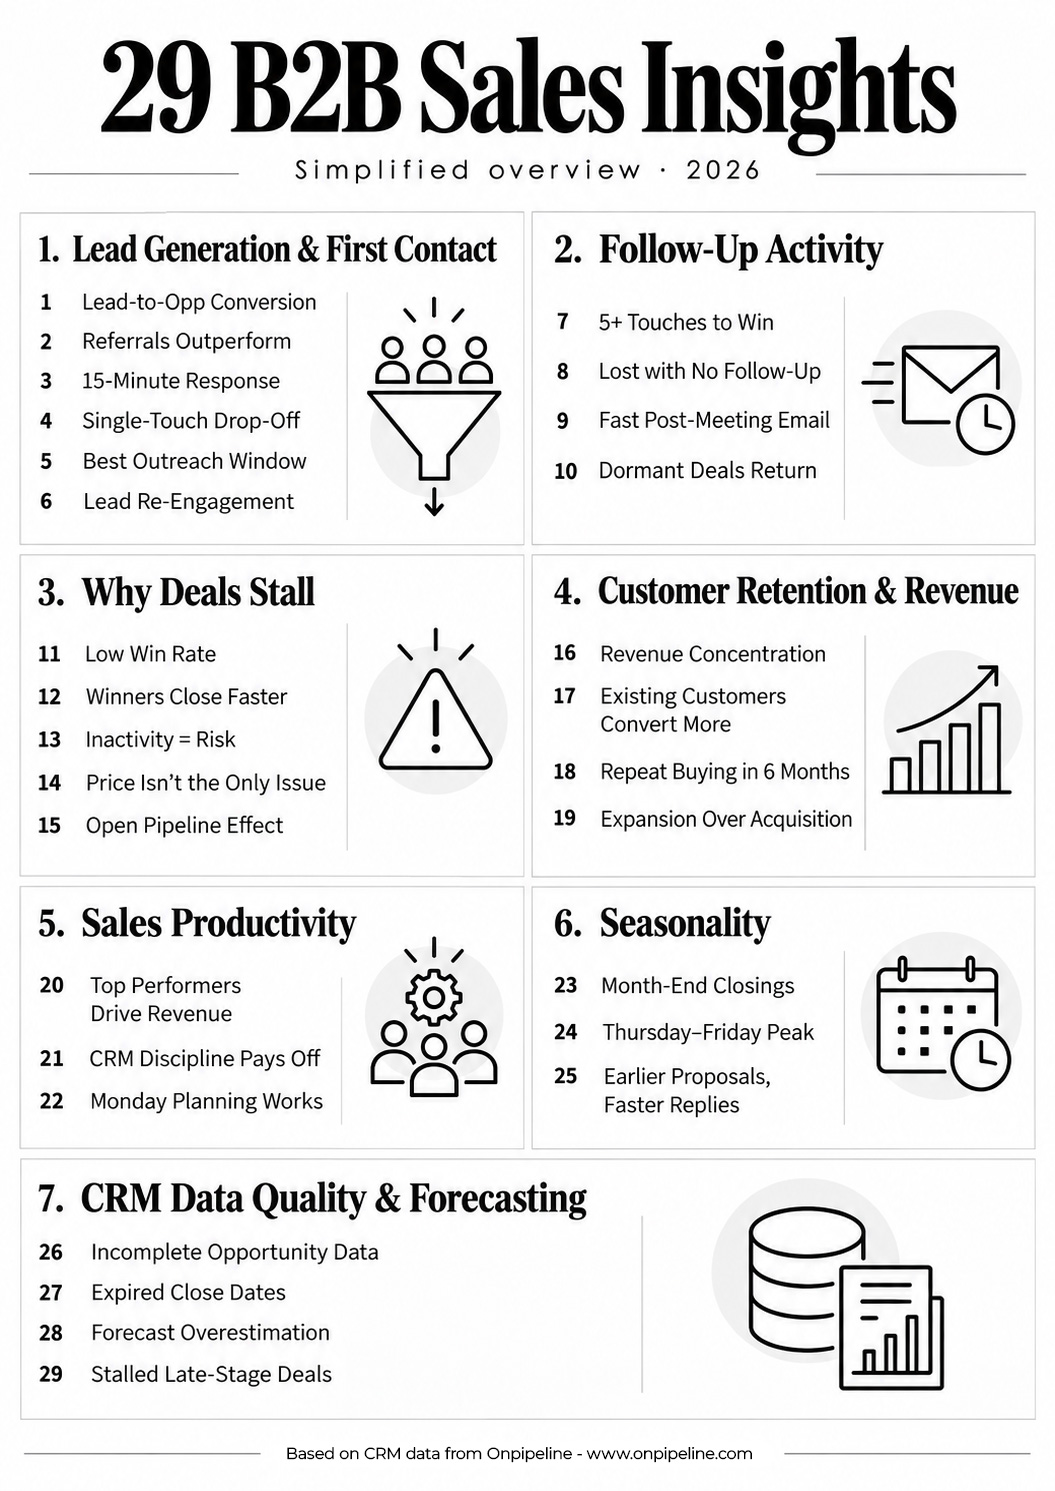
This study was conducted anonymously across 100 B2B companies. The dataset included 50,000 leads and 28,000 sales opportunities from businesses operating in professional services, manufacturing, distribution, and business services. The findings are organized into seven core areas: lead acquisition, sales activity, opportunity management, customer and revenue performance, sales productivity, seasonality, and CRM data quality.
Companies collect vast amounts of commercial data every day: conversations with prospects, missed calls, proposals, meetings, negotiations, orders, and reasons for lost deals.
Lead Generation and First Contact
Reaching Prospects at the Right Time
The first stage of the sales process is also one of the most critical. Companies invest heavily in generating leads, but the number of contacts alone does not necessarily reflect the quality of the opportunities created.
Our analysis shows that roughly 40% of leads were converted into sales opportunities. However, the most interesting differences emerge when looking at lead sources and response times.
Customer Referrals Outperform Every Other Source
Leads referred by existing customers achieve a conversion rate of 24.8%, compared with just 6.5% for leads generated through advertising campaigns.
In other words, a referred lead is approximately 3.8 times more likely to become a customer. The most likely explanation is trust: referrals often arrive with a degree of credibility and a clearly identified need already in place.
This does not mean advertising campaigns are ineffective. They often generate much higher volumes of leads. It simply means that evaluating a sales channel requires looking beyond cost per lead alone.
Responding Within 15 Minutes Makes a Difference
Among inbound leads, those contacted within 15 minutes show a meeting-booking rate of 34.6%. When response times exceed 24 hours, that figure falls to 15.1%. Lead response time
The impact is particularly noticeable in service-based businesses, where speed often influences the prospect’s perception of responsiveness and professionalism.
27% of Leads Receive Only One Contact Attempt
More than one-quarter of all analyzed leads received a single outreach attempt before being archived or abandoned.
Among these leads, 58% had never replied to the initial communication, meaning they had not explicitly declined. Many opportunities may therefore have been lost simply because follow-up efforts stopped too soon.
Tuesday Between 10 a.m. and Noon Performs Best
Outreach conducted on Tuesdays between 10:00 a.m. and 12:00 p.m. achieves a response rate of 31.4%, compared with an overall average of 23.7%.
Wednesday mornings also outperform the average, while Monday before 9:30 a.m. and Friday after 4:00 p.m. are among the least effective time slots.
One in Five Leads Re-engages Within Three Months
A total of 21.3% of leads initially classified as “not ready to buy” showed renewed interest within 120 days, whether through an email response, a request for information, or a renewed commercial discussion.
The takeaway is clear: not-ready leads should not automatically be treated as lost leads.
| # | Insight | Key Data | Business Implication |
|---|---|---|---|
| 1 | Lead-to-Opportunity Conversion | 40% of leads become sales opportunities | Monitor lead quality alongside acquisition volume. |
| 2 | Customer Referrals Outperform Every Other Source | 24.8% conversion for referrals vs. 6.5% for advertising leads | Strengthen referral programs and customer advocacy. |
| 3 | Responding Within 15 Minutes Makes a Difference | 34.6% meeting-booking rate vs. 15.1% after 24 hours | Prioritize fast responses to inbound inquiries. |
| 4 | 27% of Leads Receive Only One Contact Attempt | 27% receive just one attempt; 58% of these never responded | Implement structured multi-touch follow-up sequences. |
| 5 | Tuesday Between 10 a.m. and Noon Performs Best | 31.4% response rate vs. 23.7% overall | Schedule outreach during higher-performing time slots. |
| 6 | One in Five Leads Re-engages Within Three Months | 21.3% of not-ready leads re-engage within 120 days | Maintain nurturing campaigns for prospects not yet ready to buy. |
Follow-Up Activity
How Many Interactions Are Needed?
B2B sales rarely close after a single conversation. Most buyers move through multiple stages of evaluation, comparison, and internal approval before making a decision.
54% of Won Deals Require at Least Five Interactions
The largest group of successful opportunities, representing 36% of all wins, required between five and seven sales interactions.
Another 18% closed only after eight or more interactions.
These activities include calls, meetings, meaningful email exchanges, and proposal revisions.
The findings suggest that consistency throughout the sales process may be just as important as the strength of the initial approach.
38% of Lost Deals Received No Follow-Up
Among opportunities closed as lost, 38% showed no recorded sales activity during the 30 days preceding closure.
This is one of the most striking findings in the analysis. A significant share of opportunities may have been abandoned without a meaningful final conversation with the prospect.
While inactivity does not prove the deal could have been recovered, it clearly highlights an area where sales managers may be able to improve performance.
Post-Meeting Follow-Up Emails Work
Follow-up emails sent within 24 hours of a sales meeting achieve a response rate of 42%. When the same communication is delayed by three days or more, the response rate drops to 29%.
Recency likely plays a role: prospects still remember the discussion, and salespeople can quickly address open questions while interest remains fresh.
16% of Sales Come From Deals Dormant for More Than 90 Days
A meaningful portion of closed deals originated from opportunities that had been inactive for at least three months. In these cases, the average time between the last interaction and reactivation was 117 days.
Common reasons included newly approved budgets, changes in decision-makers, or the emergence of a new business need.
| # | Insight | Key Data | Business Implication |
|---|---|---|---|
| 7 | 54% of Won Deals Require at Least Five Interactions | 36% require 5–7 interactions; 18% require 8 or more | Build consistent, multi-step sales engagement processes. |
| 8 | 38% of Lost Deals Received No Follow-Up | No recorded activity in the 30 days before closure | Introduce alerts for opportunities without recent activity. |
| 9 | Post-Meeting Follow-Up Emails Work | 42% response within 24 hours vs. 29% after 3 days | Send follow-up communications promptly after meetings. |
| 10 | 16% of Sales Come From Opportunities Dormant for More Than 90 Days | Average reactivation interval of 117 days | Establish systematic opportunity reactivation campaigns. |
Why Deals Stall
The pipeline sits at the center of every CRM system, providing visibility from initial interest to final decision.
Only 19% of Opportunities End in a Win
Of all opportunities analyzed, 19% were won and 46% were closed as lost. The remaining 35% were still open at the time of observation.
This distinction matters. A pipeline heavily populated with recent opportunities can appear to have a low close rate simply because many deals are still moving through the sales cycle.
Won Deals Close Faster
The average sales cycle for successful opportunities is 46 days. Lost opportunities remain open for an average of 63 days before closing.
The shortest sales cycles are typically found in standardized service offerings, while complex professional services, industrial solutions, and higher-value contracts require more time.
Stalled Opportunities Are at Greater Risk
For opportunities in the proposal stage, the likelihood of closing within the next 60 days is 33% when the customer has interacted within the previous 14 days.
When no progress has been recorded for more than 45 days, the probability drops to 12%.
Metrics like these can provide an early warning system for identifying at-risk deals.
Price Is the Main Reason for Loss in Only 31% of Cases
Nearly seven out of ten lost opportunities are attributed to reasons other than price. This finding challenges one of the most common assumptions in sales: that discounting is the solution to every struggling deal.
Customers may postpone a purchase because there is no immediate urgency, because internal approval is required, or because the proposal does not fully address their needs.
| # | Insight | Key Data | Business Implication |
|---|---|---|---|
| 11 | Only 19% of Opportunities End in a Win | 19% won, 46% lost, 35% still open | Separate completed deals from active opportunities when analyzing conversion. |
| 12 | Won Deals Close Faster | 46-day average sales cycle for won deals vs. 63 days for lost deals | Identify prolonged sales cycles and address potential obstacles. |
| 13 | Stalled Opportunities Are at Greater Risk | 33% probability of closing within 60 days with recent interaction vs. 12% after prolonged inactivity | Monitor opportunity inactivity as an early risk indicator. |
| 14 | Price Is the Main Reason for Loss in Only 31% of Cases | 31% price-related losses; 69% attributed to other reasons | Investigate non-price objections before offering discounts. |
| 15 | Open Opportunities Represent a Significant Share of the Pipeline | 35% of all opportunities remain open | Account for unfinished sales cycles when evaluating pipeline performance. |
Customer Retention and Revenue
One of the most valuable insights a CRM can provide concerns revenue distribution.
Not all customers contribute equally. Some make a single purchase, while others develop long-term relationships that generate recurring opportunities over many years.
18% of Customers Generate 57% of Revenue
Within the sample, fewer than one-fifth of customers accounted for more than half of total revenue. The remaining 82% generated just 43% of revenue.
This concentration highlights the importance of monitoring satisfaction, renewals, and churn risk among key accounts.
Existing Customers Convert at 44%
Opportunities created within existing customer accounts convert at a rate of 44%.
For new prospects, the figure is 23%, based solely on completed opportunities.
Established relationships and prior familiarity reduce many of the barriers that typically slow down the buying process.
26% of Customers Buy Again Within Six Months
Among customers whose behavior could be tracked for at least six months following their first purchase, 26% placed a second order within 180 days.
Repeat purchase rates are higher in recurring services and B2B distribution, and naturally lower in machinery sales and industrial solutions.
| # | Insight | Key Data | Business Implication |
|---|---|---|---|
| 16 | 18% of Customers Generate 57% of Revenue | Top 18% generate 57%; remaining 82% generate 43% | Protect strategic accounts and monitor revenue concentration. |
| 17 | Existing Customers Convert at 44% | 44% conversion for existing customers vs. 23% for new prospects | Prioritize account expansion and cross-selling opportunities. |
| 18 | 26% of Customers Buy Again Within Six Months | 26% make a second purchase within 180 days | Develop post-purchase engagement and retention programs. |
| 19 | Existing Customers Convert Almost Twice as Often | 44% vs. 23%, approximately 1.9 times higher | Allocate sales resources to opportunities within established accounts. |
Sales Productivity
CRM data can reveal not only which opportunities are most likely to close, but also how top-performing salespeople organize their work. The analysis compared 428 sales representatives and uncovered significant differences in behavior, productivity, and activity management.
20% of Salespeople Generate 46% of Revenue
Performance concentration is clear: the top-performing fifth of sales representatives produce nearly half of all revenue acquired. However, factors such as territory quality, customer portfolio maturity, and average deal value can influence these results.
For this reason, individual performance should always be evaluated within its broader context.
Salespeople Who Consistently Update the CRM Perform Better
Sales representatives who update their opportunities at least four days per week achieve a 41% success rate on closed opportunities. Those who use the CRM less consistently achieve 34%.
While this does not prove that CRM usage and sales data analysis directly causes better results, it does suggest a strong connection between sales discipline and successful execution.
Planning on Monday Leads to Better Results
Salespeople who begin the week with clearly defined priorities and activities close, on average, 13% more deals than colleagues without a structured weekly plan.
As with the previous finding, correlation does not necessarily imply causation, but the relationship is difficult to ignore.
| # | Insight | Key Data | Business Implication |
|---|---|---|---|
| 20 | 20% of Salespeople Generate 46% of Revenue | Top 20% of representatives produce 46% of revenue | Analyze successful sales practices while accounting for territory and portfolio differences. |
| 21 | Salespeople Who Consistently Update the CRM Perform Better | 41% win rate vs. 34% among less consistent users | Encourage regular CRM updates and structured opportunity management. |
| 22 | Planning on Monday Leads to Better Results | 13% more deals closed on average among salespeople with weekly plans | Introduce structured weekly sales planning routines. |
Seasonality
When Sales Actually Happen
Industry dynamics, work calendars, budget cycles, and customer purchasing habits all influence both the number of opportunities generated and the timing of deal closures.
36% of Deals Close at Month End
A substantial portion of sales activity is concentrated toward the end of the month. Sales targets, expiring offers, and budget review cycles likely contribute to this pattern.
The finding also highlights the importance of distinguishing between customer-driven deadlines and deadlines created by the sales organization itself.
Thursday and Friday Account for 47% of Closed Deals
Looking at weekly distribution, Thursday and Friday together represent 47% of all won opportunities.
Tuesday stands out for the number of meetings scheduled, while Friday sees particularly high volumes of purchase confirmations and signed contracts.
Proposals Sent Before 1 p.m. Receive Faster Responses
Commercial proposals sent earlier in the day receive a median first-response time of 1.8 business days. For proposals sent after 5 p.m., the median increases to 2.6 business days.
The difference may reflect common business email-reading habits and decision-makers’ working schedules.
| # | Insight | Key Data | Business Implication |
|---|---|---|---|
| 23 | 36% of Deals Close at Month End | 36% of closed deals occur toward the end of the month | Align forecasting and closing activities with monthly sales patterns. |
| 24 | Thursday and Friday Account for 47% of Closed Deals | 47% of won opportunities close on Thursday or Friday | Plan contract finalization and sales support accordingly. |
| 25 | Proposals Sent Before 1 p.m. Receive Faster Responses | Median response time of 1.8 business days vs. 2.6 days for proposals sent after 5 p.m. | Send commercial proposals earlier in the working day when practical. |
CRM Data Quality and Forecasting
The final area focuses on a topic that is often overlooked: the reliability of CRM data.
Even the most sophisticated CRM system will produce poor guidance if opportunities are not updated, key data is missing, or activities go unrecorded.
32% of Open Opportunities Contain Incomplete Data
Nearly one-third of active opportunities are missing at least one critical field, such as expected value or estimated close date.
These gaps make prioritization more difficult and reduce forecasting accuracy.
18% of Opportunities Have an Expired Close Date
Almost one in five open opportunities has an expected close date that had already passed at the time of analysis, without any corresponding update.
This can artificially inflate short-term sales forecasts.
Revenue Forecasts Are Overestimated by 12% on Average
Comparing monthly forecasts with actual revenue reveals an average positive variance of 12%. In practical terms, companies tend to predict stronger results than they ultimately achieve.
Organizations that conduct weekly pipeline reviews show lower forecasting errors.
23% of Opportunities Remain Stalled for More Than One Month
Nearly one-quarter of opportunities categorized as “close to closing” show no measurable progress for at least 30 days.
This suggests that an advanced pipeline stage is not necessarily a reliable indicator of an imminent sale.
Without clear criteria for stage progression, the pipeline can become more optimistic than reality.
| # | Insight | Key Data | Business Implication |
|---|---|---|---|
| 26 | 32% of Open Opportunities Contain Incomplete Data | Almost one-third lack at least one critical field | Enforce essential CRM data-entry requirements. |
| 27 | 18% of Opportunities Have an Expired Close Date | Nearly one in five open opportunities has an outdated expected closing date | Implement automated date validation and pipeline reviews. |
| 28 | Revenue Forecasts Are Overestimated by 12% on Average | Average positive forecast variance of 12% | Improve forecasting discipline through regular pipeline reviews. |
| 29 | 23% of Opportunities Remain Stalled for More Than One Month | 23% of near-closing opportunities show no progress for at least 30 days | Establish measurable criteria for pipeline stage progression. |
What Do These Numbers Really Tell Us?
Five key themes emerge from this analysis.
- Speed and consistency matter. Responding quickly, securing meetings, and maintaining an active dialogue throughout the sales process are measurable behaviors associated with significantly different outcomes.
- Lead quality matters more than lead volume. A large number of contacts does not automatically translate into more customers. Lead source, initial trust, and buying intent all have a major impact on conversion rates.
- Price is only part of the story. Timing, priorities, competition, and internal decision-making processes often play an equally important role in determining outcomes.
- Existing customers represent a powerful growth opportunity. Organizations that understand their customers’ needs and maintain ongoing relationships create stronger foundations for future revenue.
- Data quality matters. A CRM used merely as a digital filing cabinet rarely creates a competitive advantage. Its value increases when information is consistently updated, properly analyzed, and turned into actionable decisions.
The most important lesson from this study is that improving sales performance does not necessarily require finding more customers. Often, better results come from managing existing opportunities, relationships, and information more effectively.