Free quiz to know your sales aptitude
 Sales Pipeline Calculator
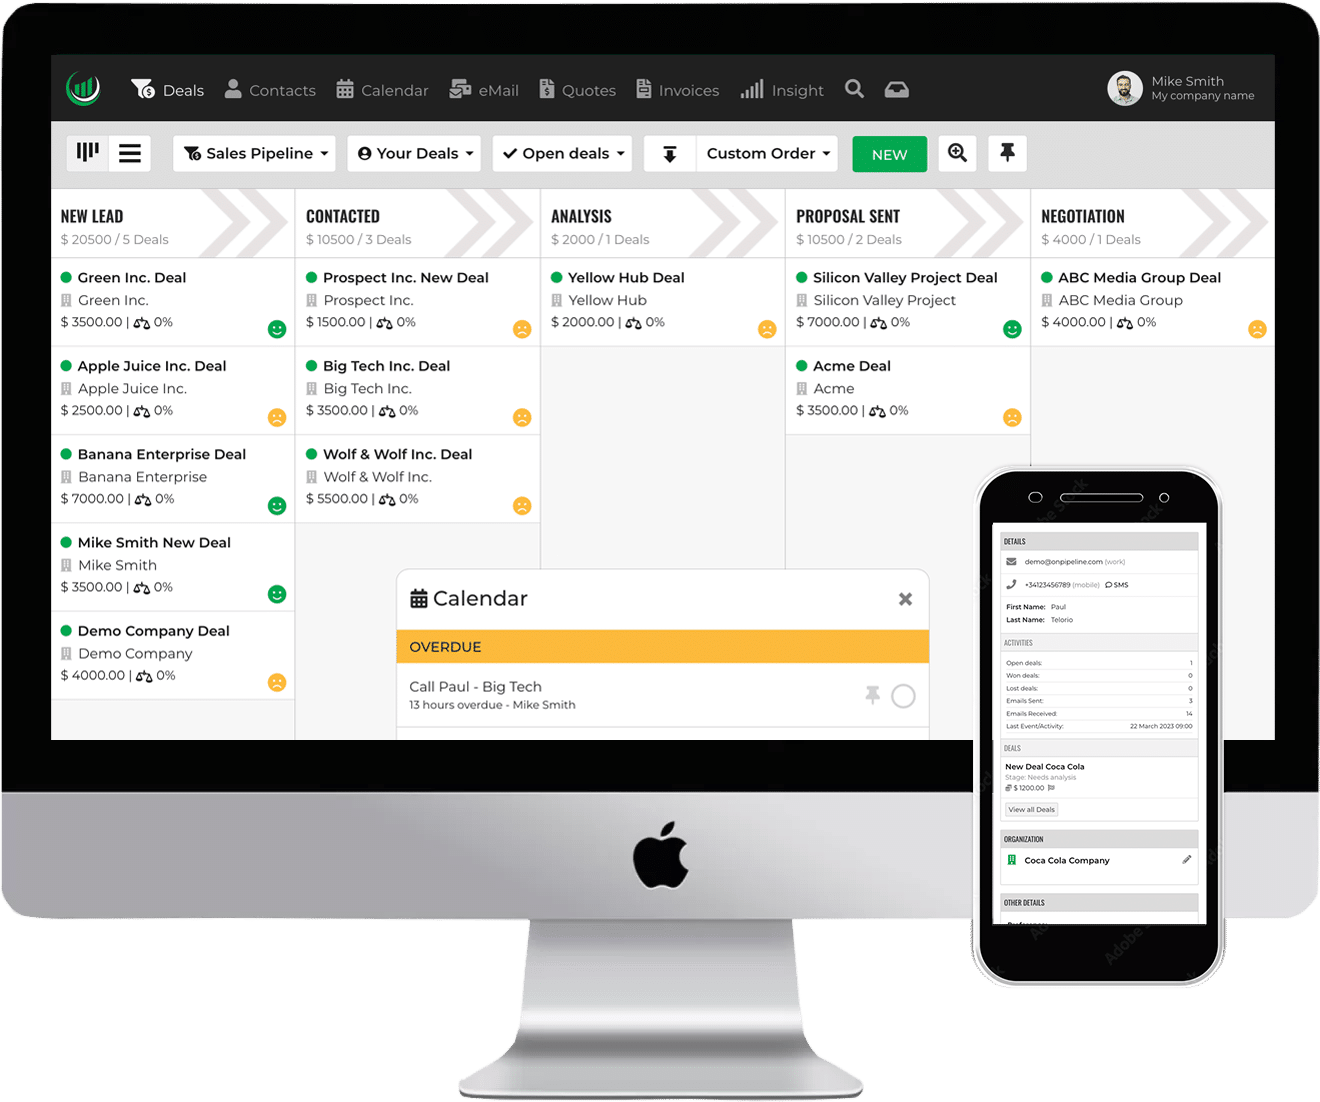
Keeping track of your CRM activities is the first step to improve your sales processes. The earlier you start measuring data, the more information you will have to support your decisions.
What is Sales Analysis?
Sales analysis is the study of sales data to discover trends, patterns, and insights for sales strategy. To do this, you gather, tidy up, and study data from different places, like CRM systems, e-commerce platforms, and accounting software.
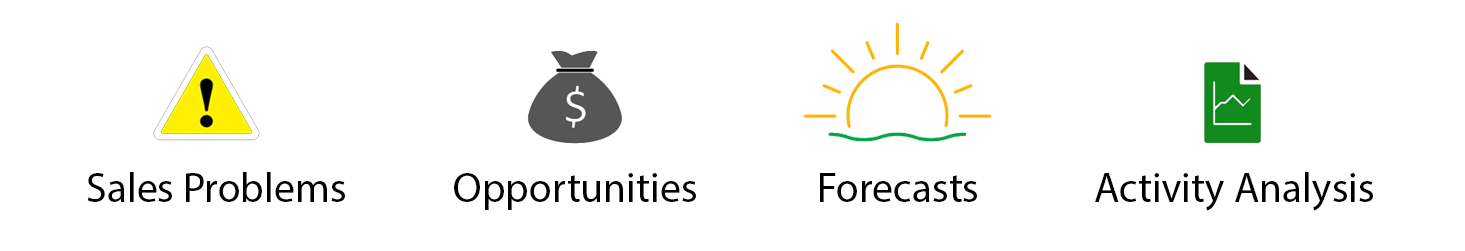
It is achieved by extracting data to evaluate the performance of your sales team. From your data, you can understand:
- Sales problems
- Market opportunities
- Forecasts
- Activities that generate revenue
Regular analysis of CRM sales data in sales management provides a picture of the products your customers are buying, from which sales rep., etc. All these aspects allow you to optimize the sales process.
Identify your customers!
Your salespeople should spend more time interacting with
- the most profitable customers
- the customers who are loyal to your company
Based on what you intend to achieve, you can try to evaluate parameters such as improved success rates, revenue growth, customer satisfaction, improved productivity, cost-effectiveness, increased market share, etc. to determine the current state of your business.
Once you have identified the areas of improvement, you can work on the gaps to get your business back on track and to the position “where you need to be”.
You should also analyze the effectiveness of the measures you take and make necessary changes or adjustments to ensure that your business continues to flourish.
The success rate
Monitoring your sales win rate is a critical part of pipeline analysis.
Knowing which sales tactics are working, and which are not, can help inform strategic decisions that can improve overall sales performance.
In fact, by tracking success rates across the sales process, business leaders can identify areas of improvement, gain insights into customer preferences and buying behaviors, and create more targeted campaigns that are better aligned with customer needs.
Additionally, by tracking success rates, businesses can ensure that their sales team is following best practices and making the most out of their time and resources.
For example, if you have an overall conversion rate (from “created deals” to “won deals”) of 5%, it means that 95% of your deals are lost somewhere in the sales pipeline.
Therefore, thanks to the history of each opportunity in your CRM software helps you can identify and remove bottlenecks in the sales process.
If 50% of your deals are lost, for example in the “Send presentation” stage, there is probably something in this activity that is discouraging the customer.
Try to understand what to change in the sales approach, probably the presentation is too general and it is necessary to send something more personalized, perhaps after a telephone interview.
Reasons why you lose Deals
Collecting the data behind lost deals is an invaluable part of the analysis. By understanding why a customer has decided not to purchase a product or service, businesses can modify their strategies to better meet customer needs.
Additionally, analyzing this data can provide insights into customer trends and preferences, as well as potential areas for improvement in the sales process.
With this information, businesses can make more informed decisions that can help them increase sales and profitability in the long run.
Identify inefficiencies in your team
By analyzing the team’s data, you will be able to identify any areas of sales that may not be performing as expected.
In fact, you can then use this data to make informed decisions about how to improve sales performance, as well as pinpoint any areas that may need additional focus or resources.
Finally, analysis of the sales process can help you to create strategies and tactics that are tailored to the specific needs of the organization and its target market.
It could be because you’ve assigned too many deals to your salespeople and aren’t able to handle them all, or you have a salesperson who is working a lot of good leads but can’t convert them to sales.
If you manage a large sales team, your CRM might give you good reasons to consider a different organizational structure.
For example, if you notice that 70% of a specific activity is not completed, you might want to dig deeper to understand why. There may be too many activities or parts of the process is taking up a lot of time, which could mean it’s time to hire.
How to do sales analysis
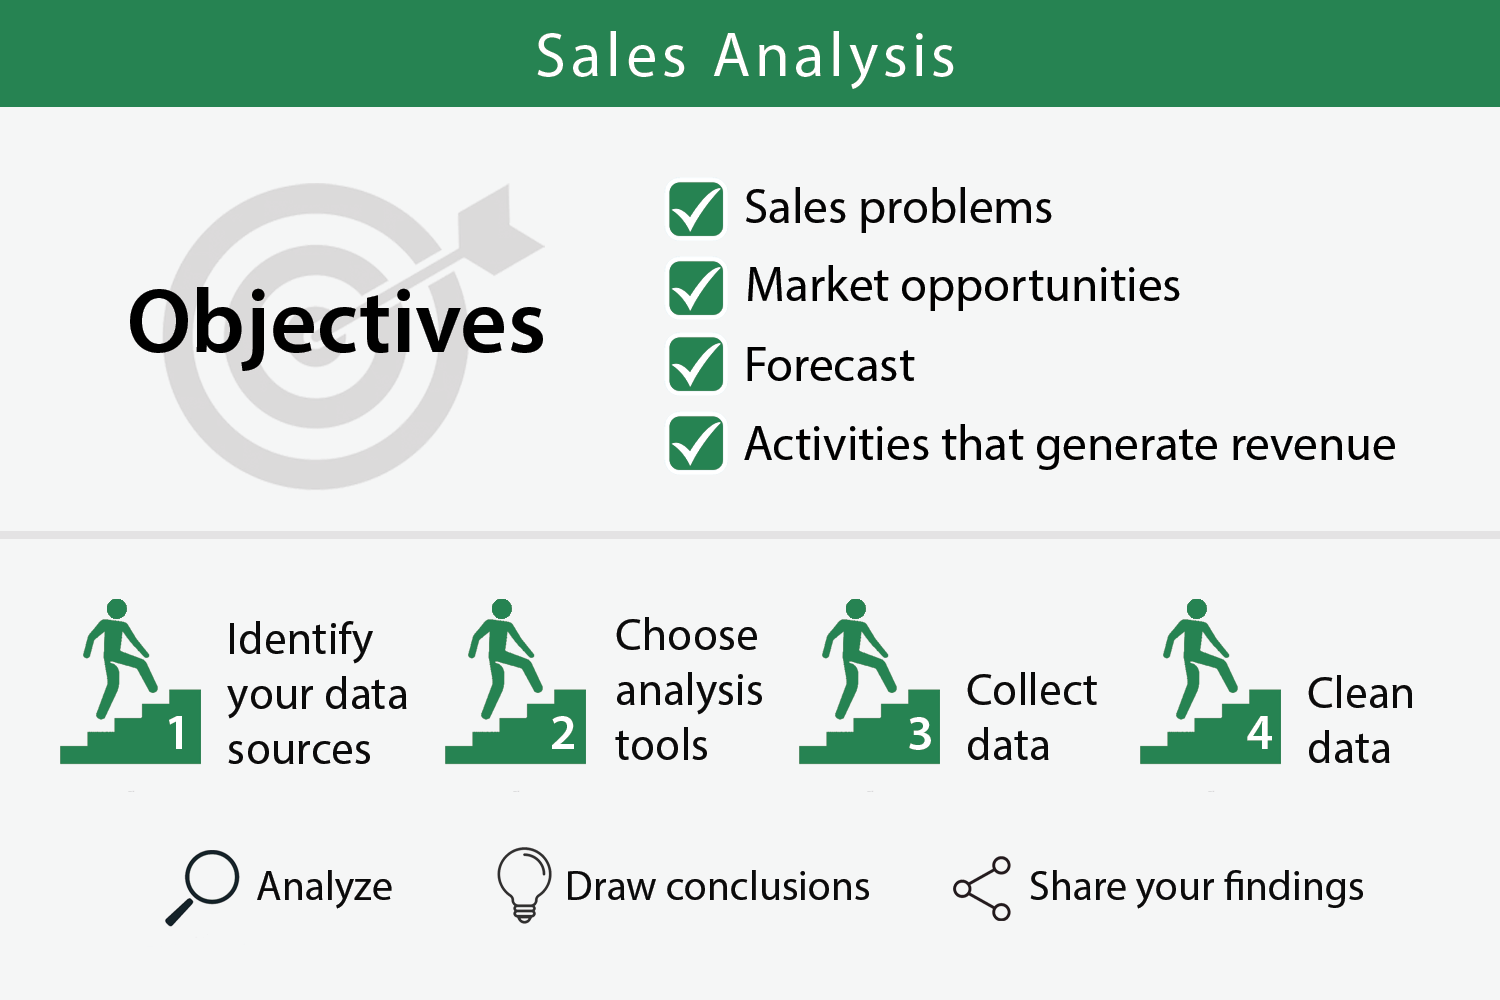
1. Define your objectives and metrics
Before you start analyzing your sales data, it’s important to define what you want to achieve. What are your sales goals? What do you want to measure? Once you know your objectives, you can choose the right metrics to track your progress.
Some common sales metrics include:
- Revenue: This is the total amount of money you’ve generated from sales.
- Profit: This is the difference between your revenue and your expenses.
- Gross margin: This is the percentage of your revenue that you keep after you’ve paid for your cost of goods sold.
- Sales conversion rate: This is the percentage of leads that you convert into customers.
Average deal size: This is the average amount of money you make per customer.
2. Identify your data sources
Your sales data may come from a variety of sources, such as your CRM system, your e-commerce platform, and your accounting software. It’s important to identify all of your data sources so that you can collect the data you need.
3. Collect data
Once you know where your data is, you need to collect it. You can do this manually, or you can use a data collection tool.
4. Clean data
Before you can analyze your data, you need to make sure it’s clean and accurate. This means removing any duplicates or errors, and formatting the data correctly.
5. Choose your analysis tools
There are a variety of tools available for analyzing sales data. Some popular options include Excel, Google Sheets, and Power BI.
6. Analyze
Once you’ve chosen your tools, you can start to analyze your data. This may involve looking at trends, identifying patterns, and creating charts and graphs.
7. Draw conclusions
Based on your analysis, you can draw conclusions about your sales performance. You can also make recommendations for how to improve your results.
8. Share your findings
Share your analysis with your team and your stakeholders. This will help them to understand your sales performance and make informed decisions.
9. Monitor your progress
Sales analysis is an ongoing process. You should monitor your progress on a regular basis so that you can identify any areas where you need to improve.
Here are some additional tips for doing sales analysis:
Use a data warehouse or data lake
A data warehouse or data lake can help you to store and organize your sales data in a way that makes it easy to analyze.
- Use a data visualization tool: A data visualization tool can help you to create charts and graphs that make your data easier to understand.
- Use a machine learning tool: A machine learning tool can help you to identify trends and patterns in your data that you may not have noticed otherwise.